Tec4med
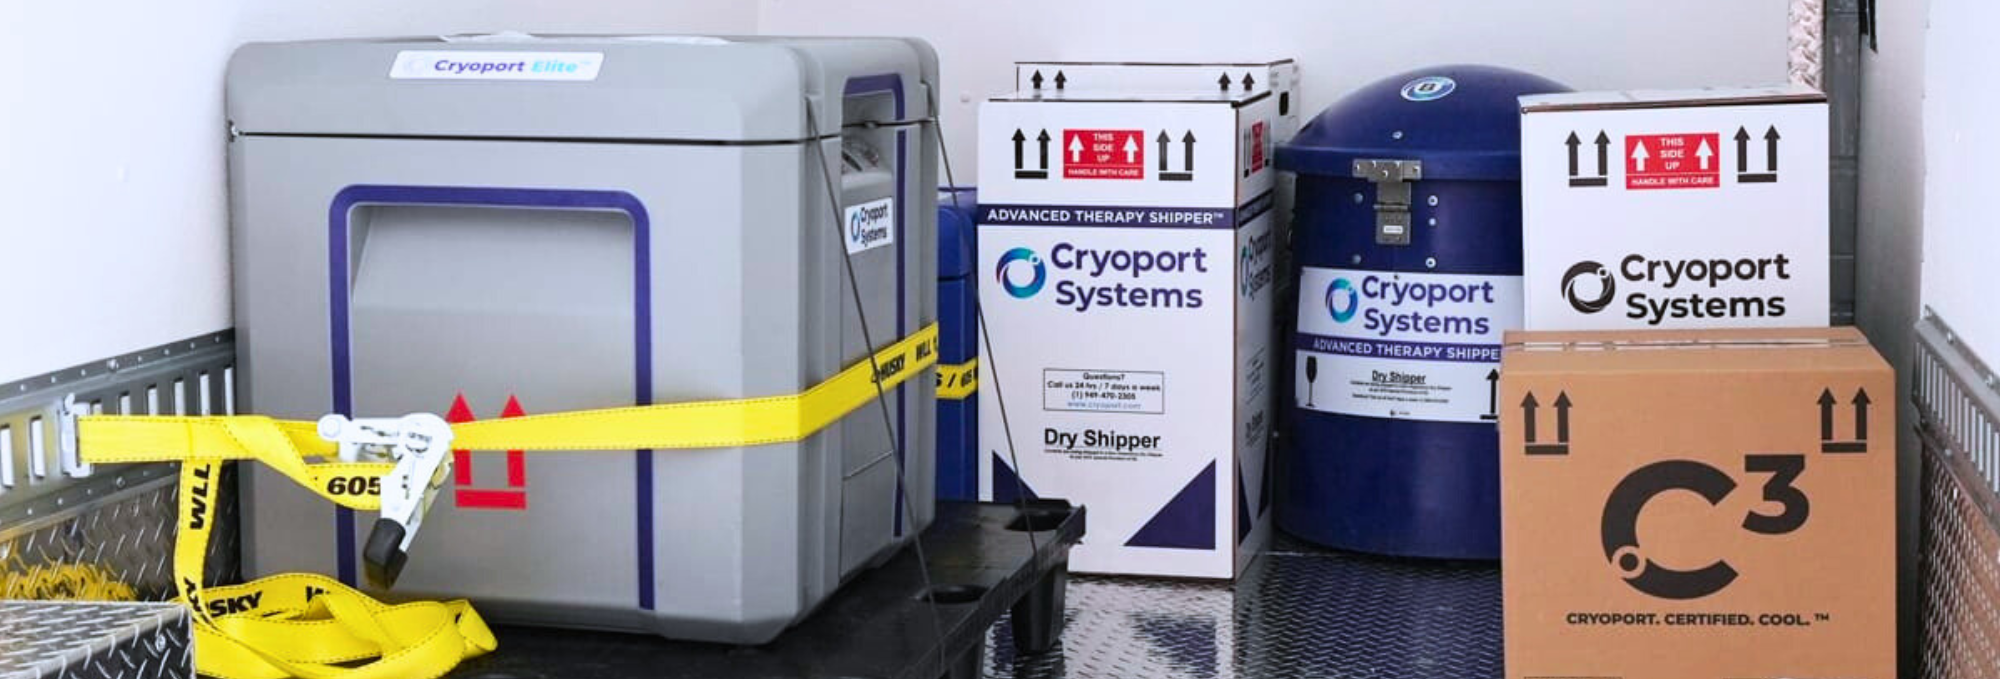
In November, 2023, Cryoport, Inc.acquired Tec4Med Lifescience GmbH – a solution provider and innovation leader in the pharmaceutical supply chain visibility, condition monitoring, and temperature-controlled packaging space.
Next Generation Pharmaceutical Supply Chain Visibility
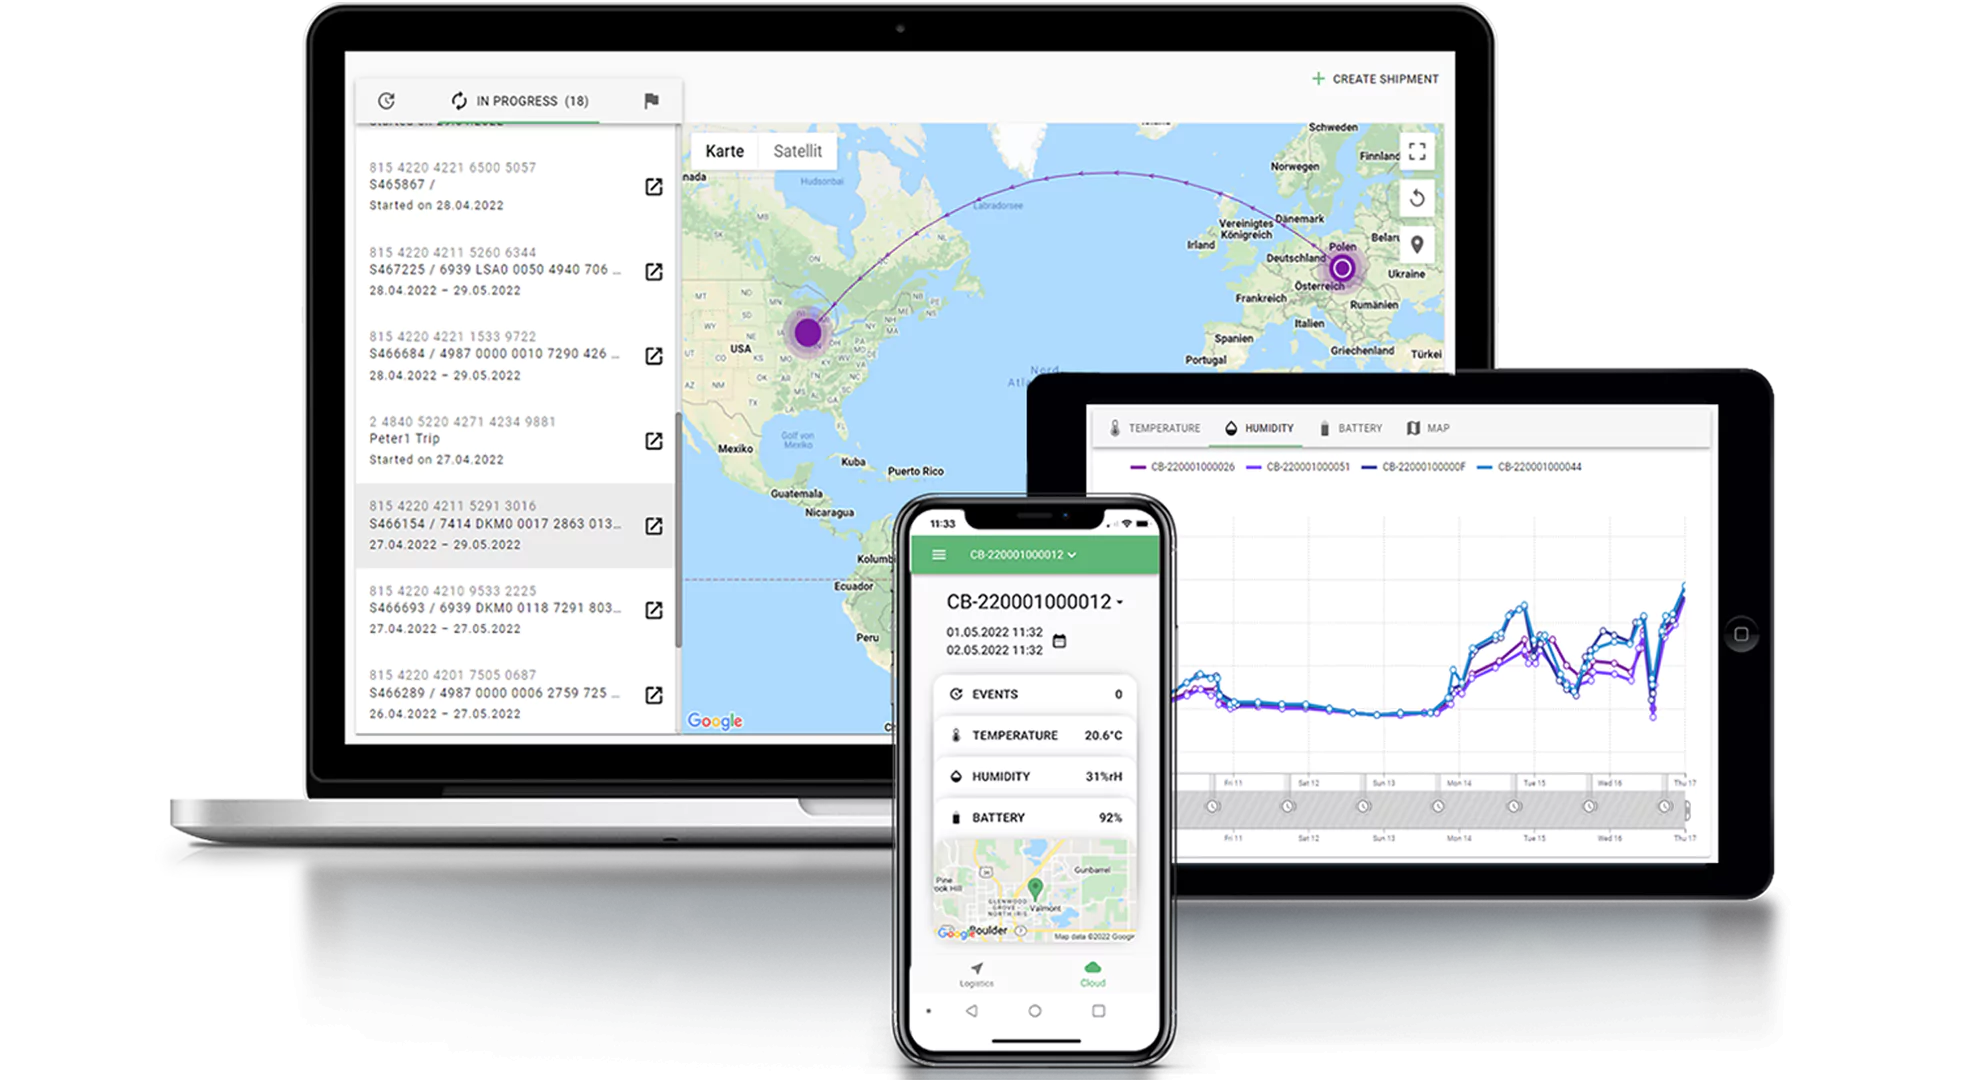
Tec4med was founded in 2017 by Nico Höler and Julian Poths as a technology spin-off of the Technical University of Darmstadt, Germany. Situated in the Frankfurt area, a global logistics hub for the pharmaceutical industry, Tec4med provides next-generation pharmaceutical supply chain visibility by integrating condition monitoring, cloud, and artificial intelligence (AI) solutions. ISO 9001-certified, Tec4med works with pharmaceutical-compliant, ready-to-use devices and intuitive easy-to-use software, offering customer-specific integrations to meet the rigorous standards of each individual client. As a Cryoport company, Tec4med will continue to be run by the current management team.